

Local Development
Introduction
Section titled “Introduction”The Getting Started - Local Development tutorial walked you through deploying a Lambda function and a DynamoDB table on LocalStack, then testing it with curl. Everything up to that point happened on the command line.
This quickstart picks up where that tutorial left off and shows the tools you can leverage to inspect, manage, snapshot, and debug your LocalStack instance. You will use the LocalStack Web Application to:
- Confirm your local instance is running and find it in the browser.
- Get a visual summary of your deployed resources with Stack Overview.
- Trigger your Lambda function and browse the resulting DynamoDB rows with the Resource Browser.
- Snapshot the entire application state, wipe it, and bring it back with Cloud Pods.
- Trace the request flow between your Lambda function and DynamoDB table with App Inspector.
By the end, you will be comfortable using the web application to enhance your workflow for local development, alongside the CLI tools you already know.
Prerequisites
Section titled “Prerequisites”-
Completed the Getting Started - Local Development tutorial, without running its Step 6 cleanup. Your
messages-apiLambda function andMessagesDynamoDB table should still be deployed. -
The LocalStack container from that tutorial still running. If you closed your terminal, the container keeps running in the background — verify with:
Terminal window lstk statusIf it reports that the AWS emulator is not running, start it again with
lstk start. Since LocalStack is ephemeral by default, this gives you a fresh, empty instance — redeploy the Lambda function and DynamoDB table from the tutorial before continuing. -
Signed in to the LocalStack Web Application.
Step by Step
Section titled “Step by Step”Step 1: Find your running instance
Section titled “Step 1: Find your running instance”Before opening the browser, confirm LocalStack is actually up and check what it currently has deployed:
lstk statusLocalStack AWS Emulator is running• Endpoint: localhost:4566• Container: localstack-main• Version: 4.9.1• Uptime: 12m 3s
~ 2 resources · 2 services
Service Resource Region AccountLambda messages-api us-east-1 000000000000DynamoDB Messages us-east-1 000000000000- Open the LocalStack Web Application and sign in.
- In the sidebar, under LocalStack Instances, click on your running instance (e.g.
localhost.localstack.cloud). The instance should display a green running badge.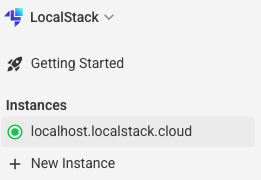
Expected result: the instance card shows a green running badge. Clicking into it opens the instance dashboard with tabs for Overview, Status, Resource Browser, State, and Extensions. The default tab is Resource Browser, which displays a list of all the resources you can inspect via the web application.
If you don’t see a running instance, see Troubleshooting before continuing.
Step 2: Inspect your app with Stack Overview
Section titled “Step 2: Inspect your app with Stack Overview”Stack Overview gives you a summary of everything deployed on the instance.
- From the instance dashboard, click the Overview tab.
- Look for the Lambda Function and DynamoDB Table items in the list.
- Click the arrow (
>) next to Lambda Function to expand it and confirmmessages-apiis listed. Do the same for DynamoDB Table to confirm theMessagestable is deployed.
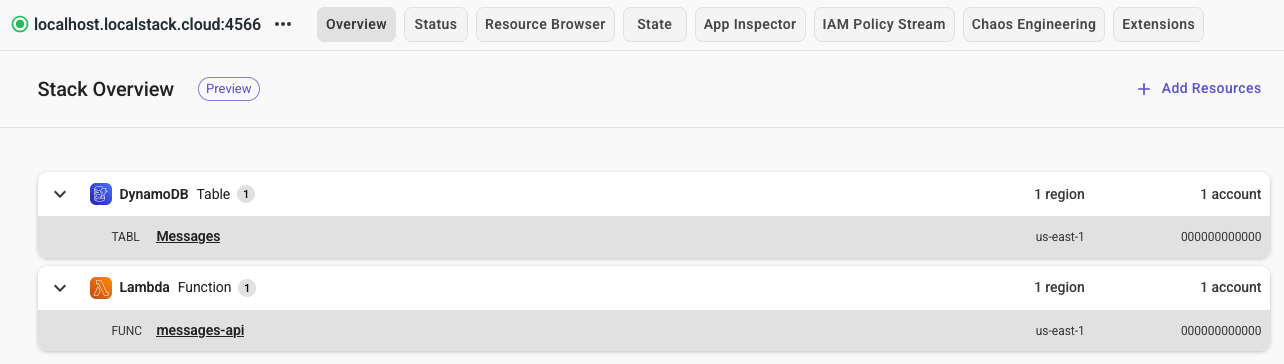
Expected result: you can confirm, at a glance, that both the Lambda function and the DynamoDB table from the tutorial are deployed without needing to use the CLI.
Step 3: Trigger the Lambda and inspect data with the Resource Browsers
Section titled “Step 3: Trigger the Lambda and inspect data with the Resource Browsers”Many supported services in LocalStack for AWS come with a resource browse that allows you to view configuration details and manage individual resources. Use it here to check the Lambda function’s configuration, trigger the function, and then validate that a new row lands in DynamoDB.
-
Navigate to the Status tab. It displays a list of the running services at the top as well as additional services that are available to use within the LocalStack emulator.
-
Under Running services, click Lambda, then, within the Functions tab, and click the
messages-apifunction. From here you can review the function’s details including the ARN, runtime, handler, and theTABLE_NAMEenvironment variable pointing atMessages. You can also update the function code, invoke the function, and view the function logs.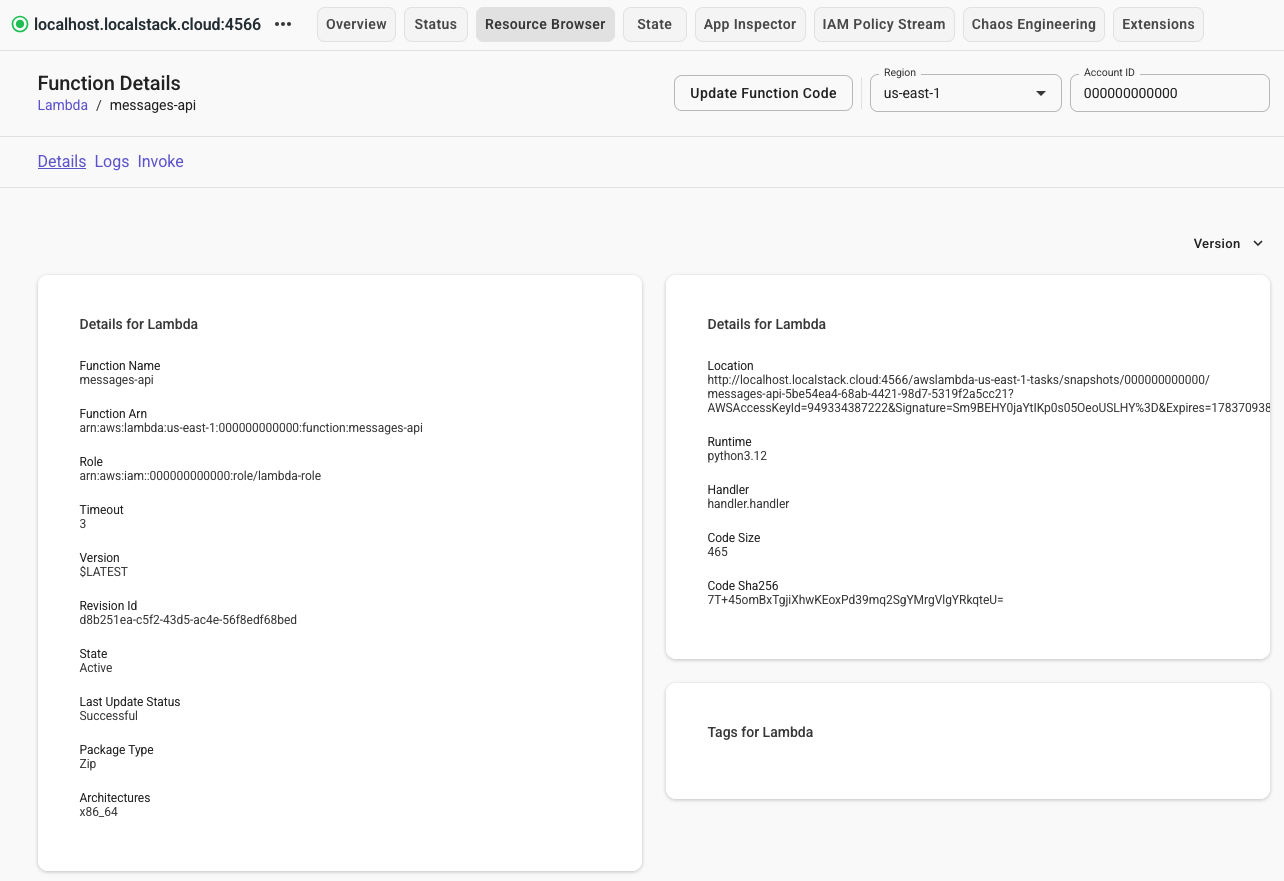
-
Click Invoke to open the invoke dialog and paste the following JSON payload into the input field:
{"message": "Checked out from the Resource Browser"} -
Click Submit to trigger the function. You will see the function invoked and the response returned. The log result of the response should look like this:
Output {"statusCode": 200,"body": {"id": "faa4dc54-f0b7-4b6b-9e52-39702af78d73","message": "Checked out from the Resource Browser"}}
With the Lambda invoked, switch to the DynamoDB side to see what it wrote:
- Back in the Status tab and click on DynamoDB and then, fromthe Tables tab, click the
Messagestable. This will open the table details page where you can view the table’s details including the table name, key schema, and the number of items in the table. - Click the Items tab to view the table’s contents. You should see the message you posted during the tutorial and the new one you just sent.
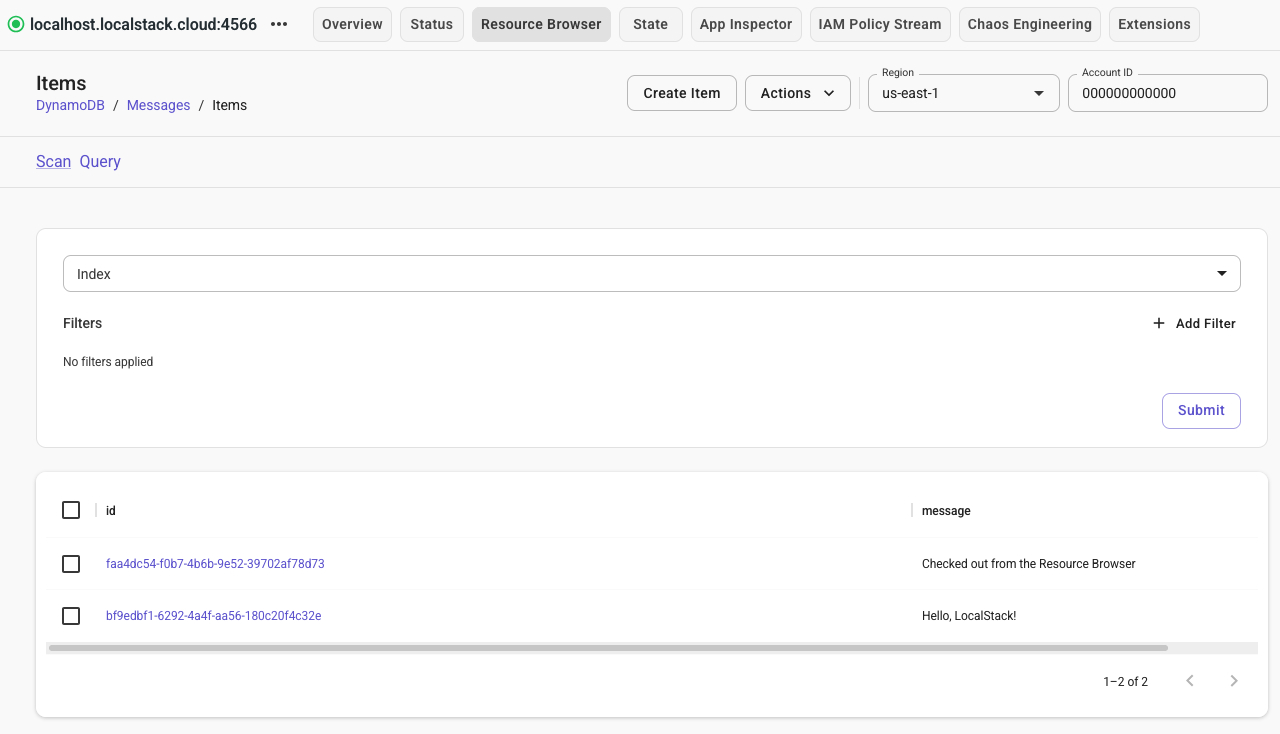
Expected result: the Items view for the DynamoDB “Messages” table lists the message you posted during the tutorial and the new one you just sent confirming that the Lambda function is writing to the table.
Step 4: Save and restore state with Cloud Pods
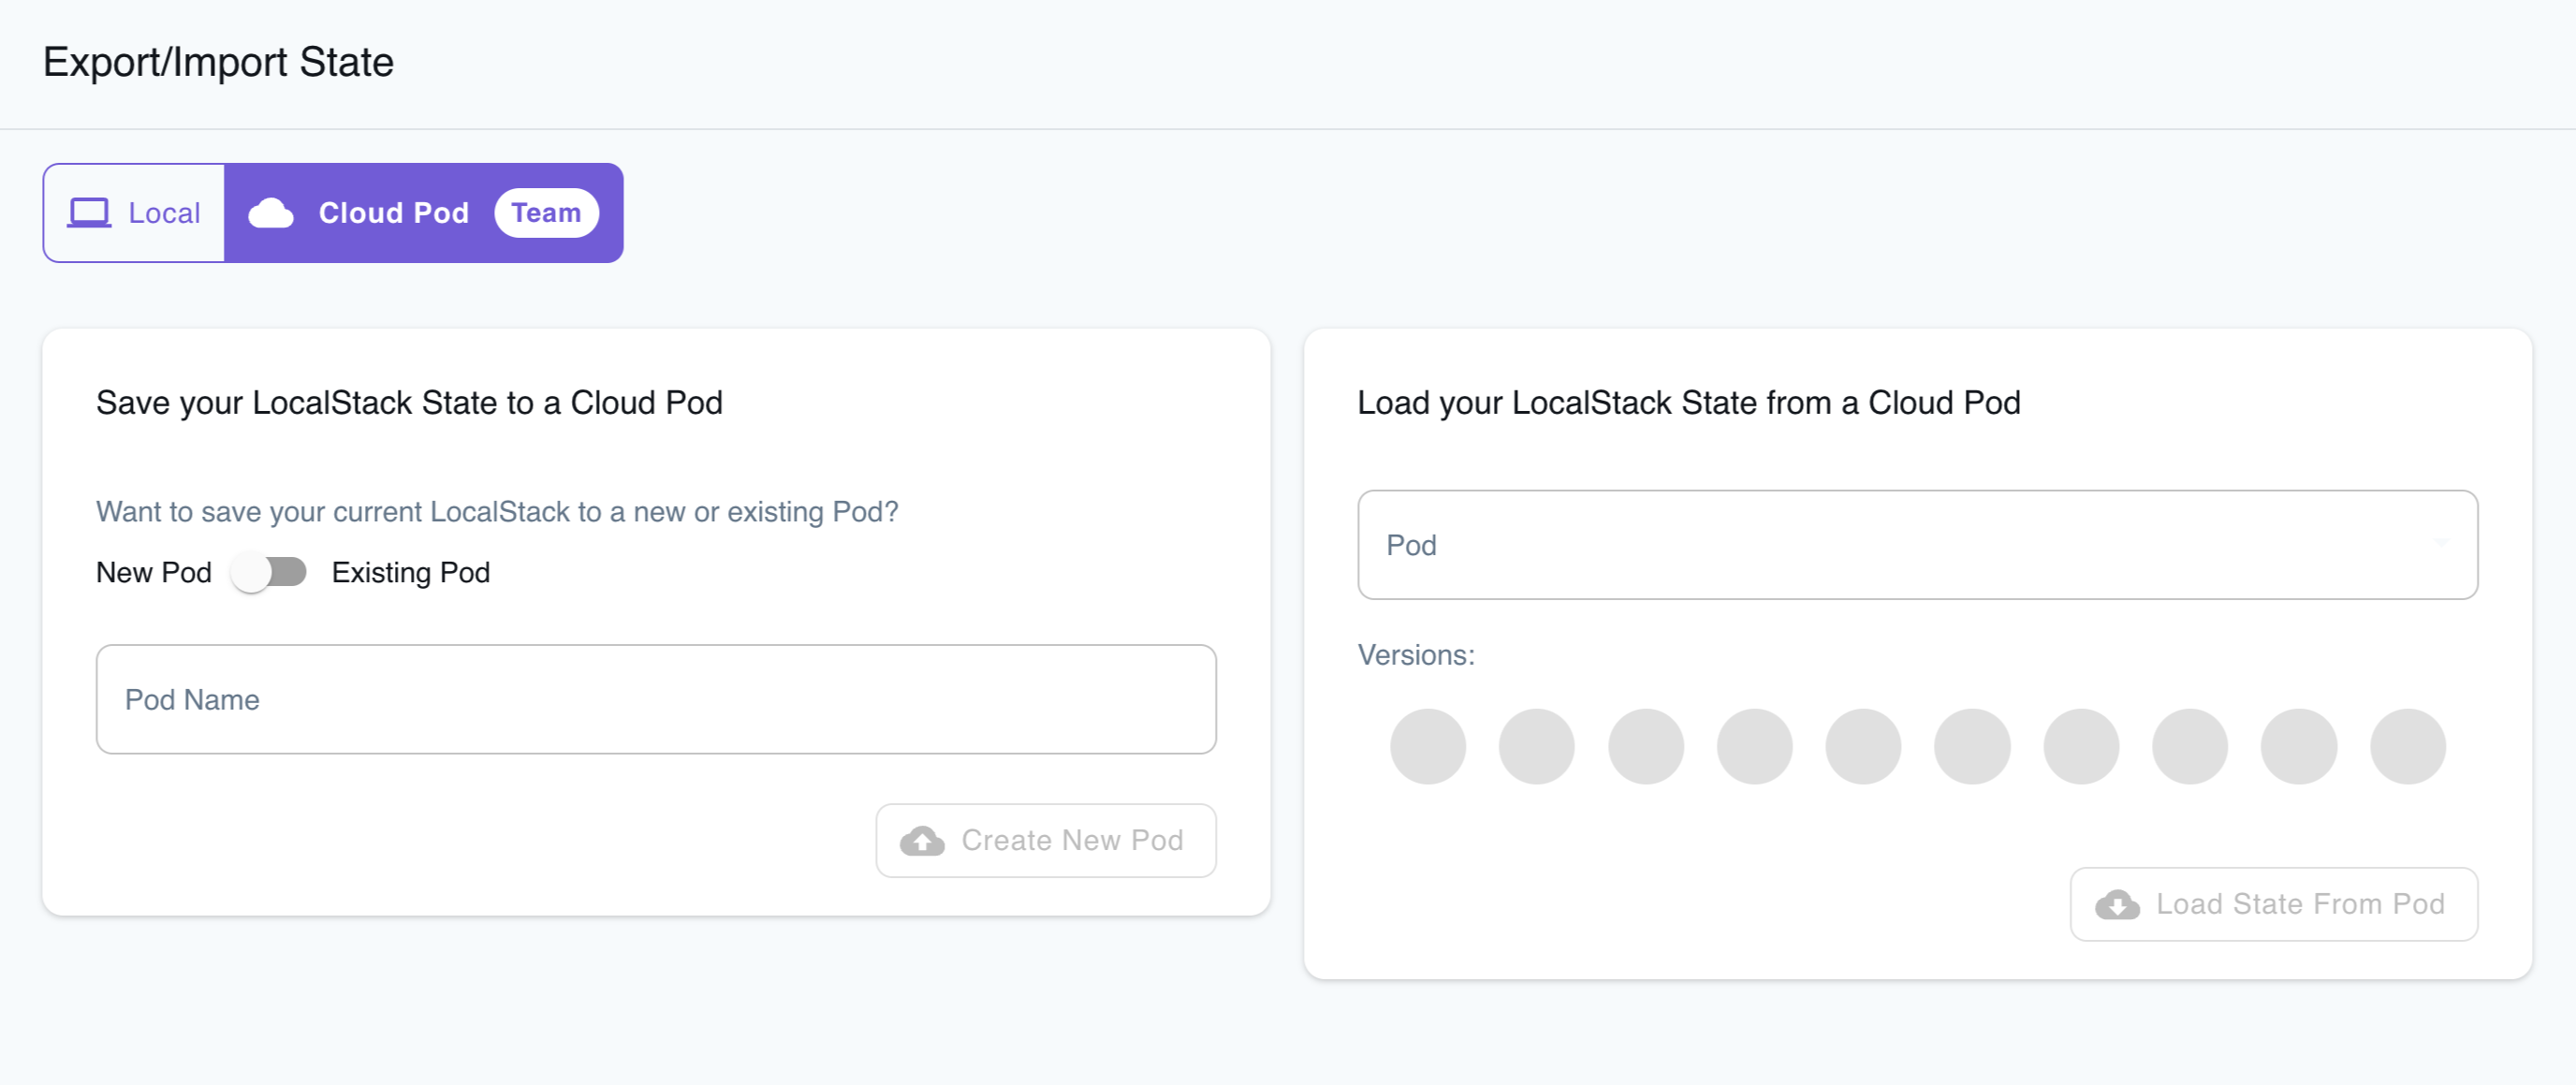
Section titled “Step 4: Save and restore state with Cloud Pods”Cloud Pods let you snapshot your entire LocalStack state — resources and their data — and bring it back later, even after the container has been stopped and restarted. Try this by saving your current app, wiping it, and restoring it.
-
Save the current state as a Cloud Pod:
Terminal window lstk snapshot save pod:messages-api-demolstkuploads the state of every running service —lambdaanddynamodb, plusiamif you deployed with Terraform — to your LocalStack account. -
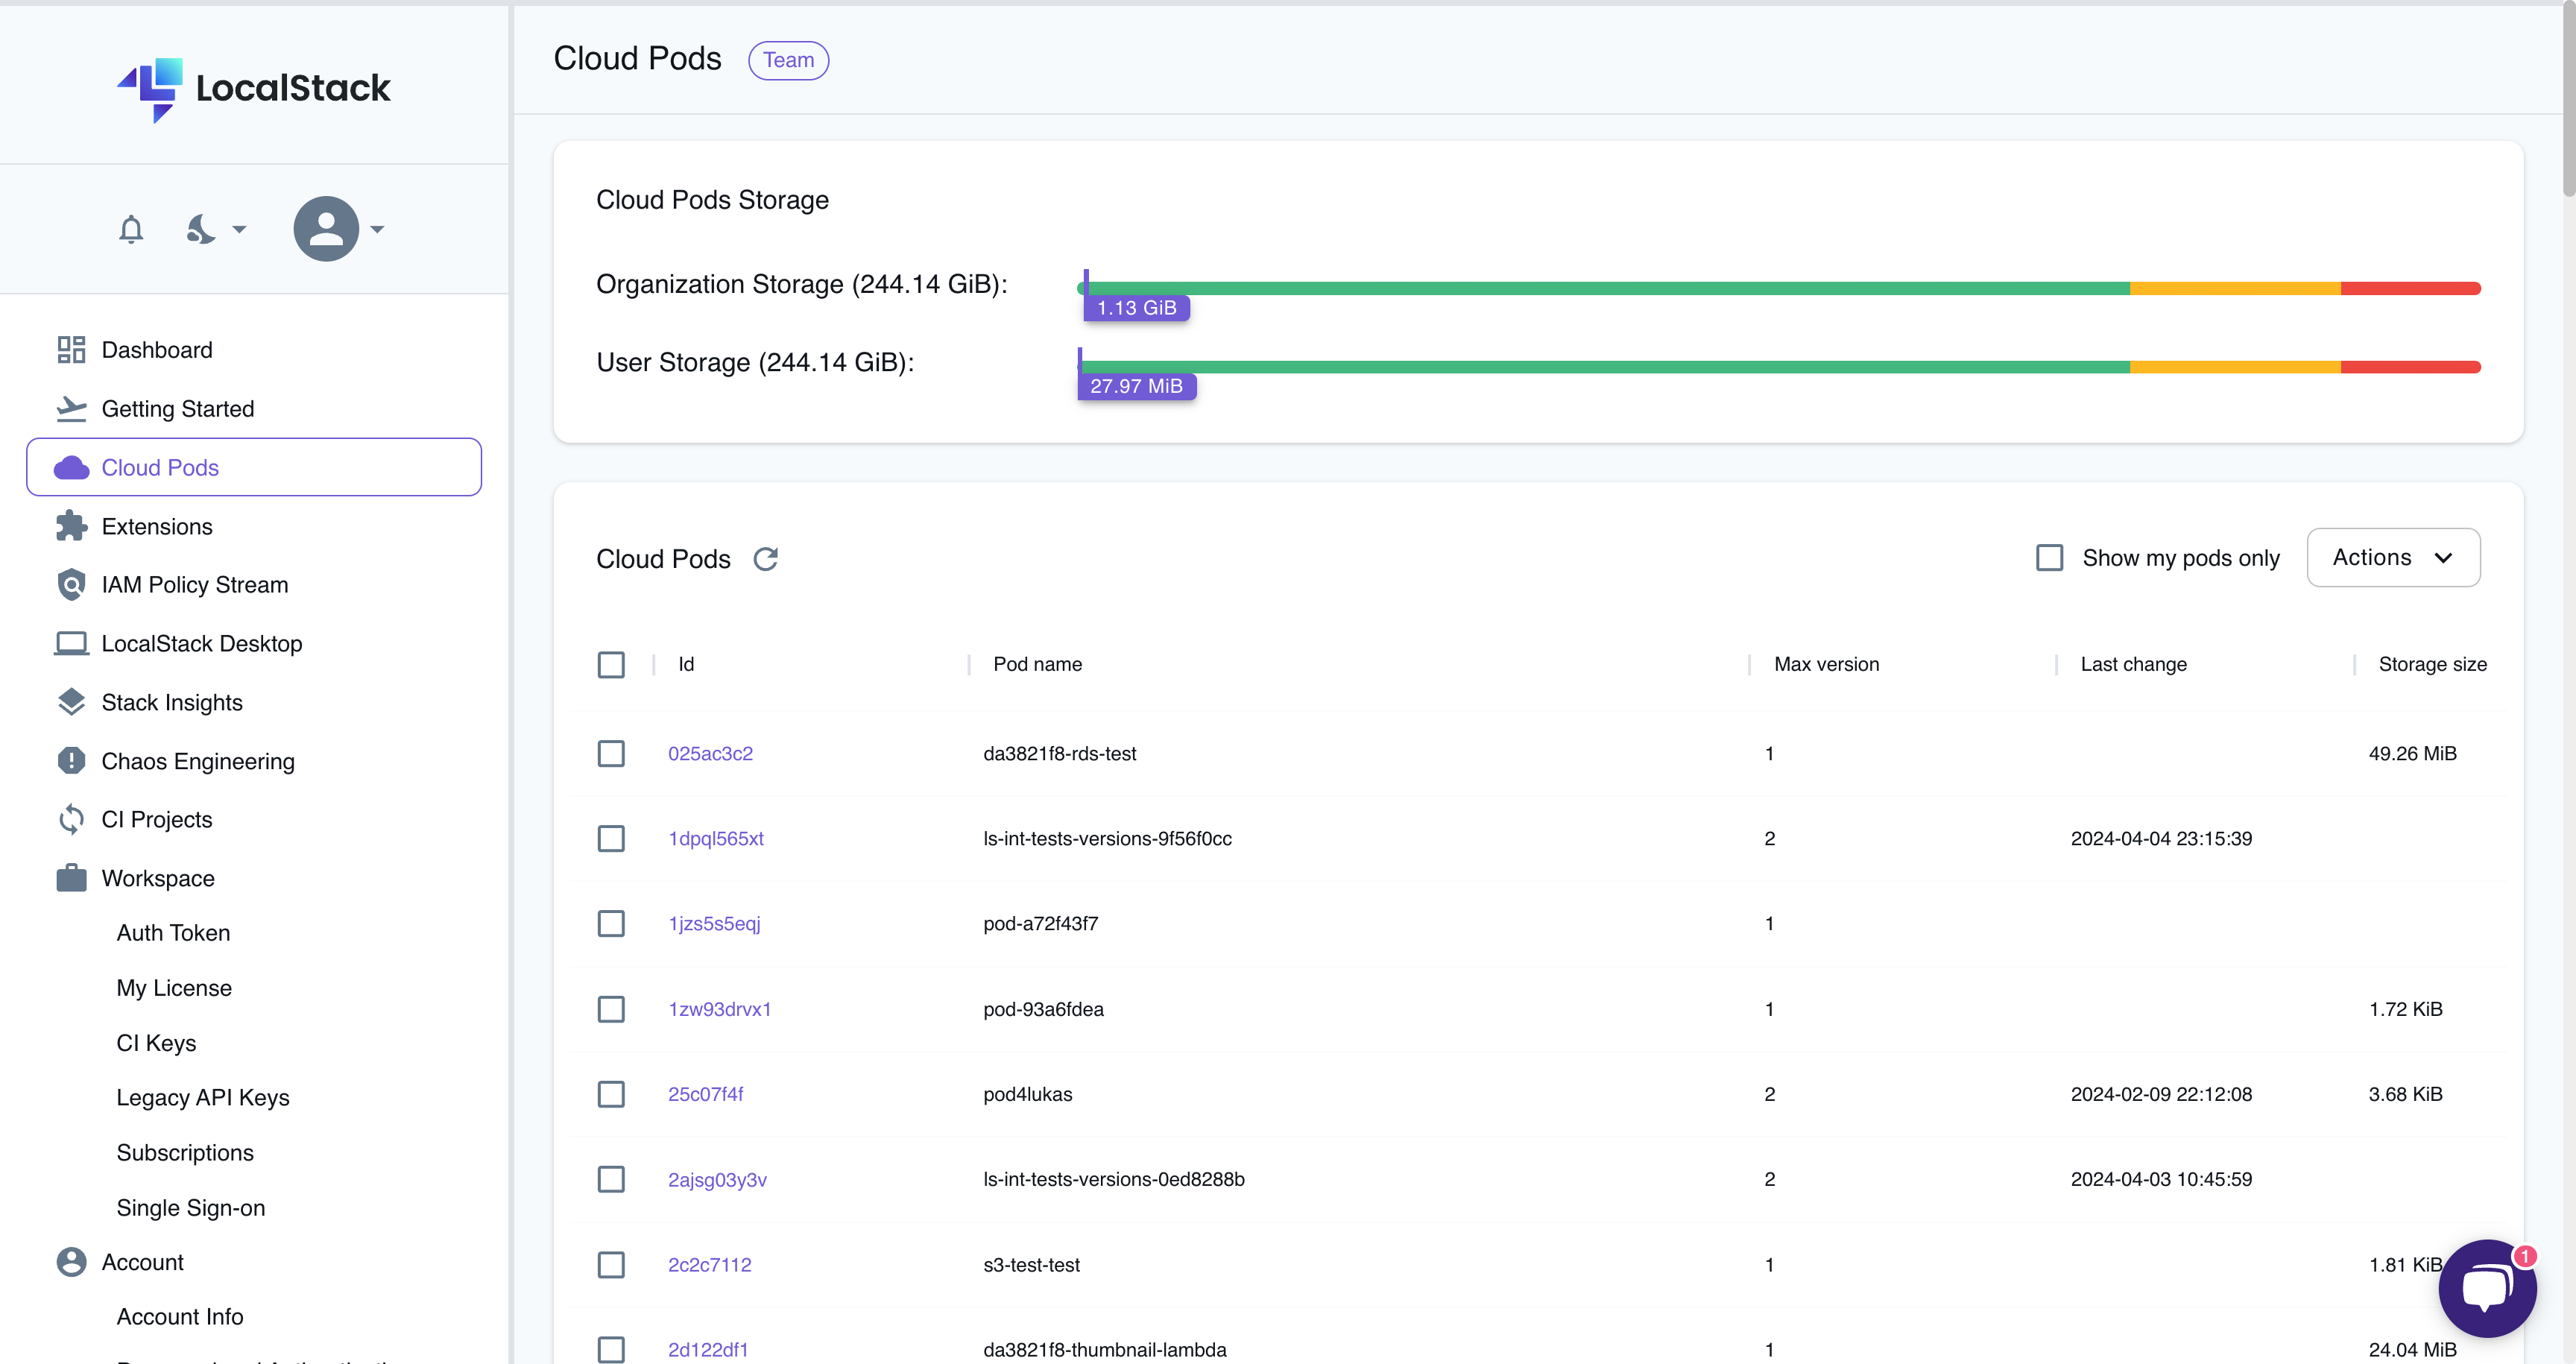
Verify it in the web application by navigating to Cloud Pods in the sidebar (
https://app.localstack.cloud/pods). You should seemessages-api-demolisted with a storage size and version1.
Now wipe the instance and confirm it’s actually gone:
-
Stop LocalStack:
Terminal window lstk stop -
Start it again as a fresh instance:
Terminal window lstk start -
Back in the Resource Browser (or Stack Overview), confirm the
messages-apifunction andMessagestable are no longer listed. LocalStack is ephemeral by default, so stopping the container discarded everything. -
Restore the snapshot:
Terminal window lstk snapshot load pod:messages-api-demo
Expected result: run lstk status again, or refresh the Resource Browser — messages-api and Messages are back. More importantly, re-run the curl request from Step 3 against the (re-fetched) function URL: the response includes every message you saved before the restart, including the one added in Step 3. Cloud Pods restore the data in the table, not just the table definition.
Step 5: Trace the request flow with App Inspector
Section titled “Step 5: Trace the request flow with App Inspector”App Inspector records every call your application makes to LocalStack, so you can see the flow between services, inspect the exact payloads exchanged, and catch IAM or configuration issues before they become deployment surprises.
- Navigate to App Inspector in the sidebar (
https://app.localstack.cloud/inst/default/appinspector/spans). - Click Clear Operations to remove the noise generated while creating your resources earlier.
- Trigger the Lambda function once more with the
curlcommand from Step 3. - Refresh the operations list.
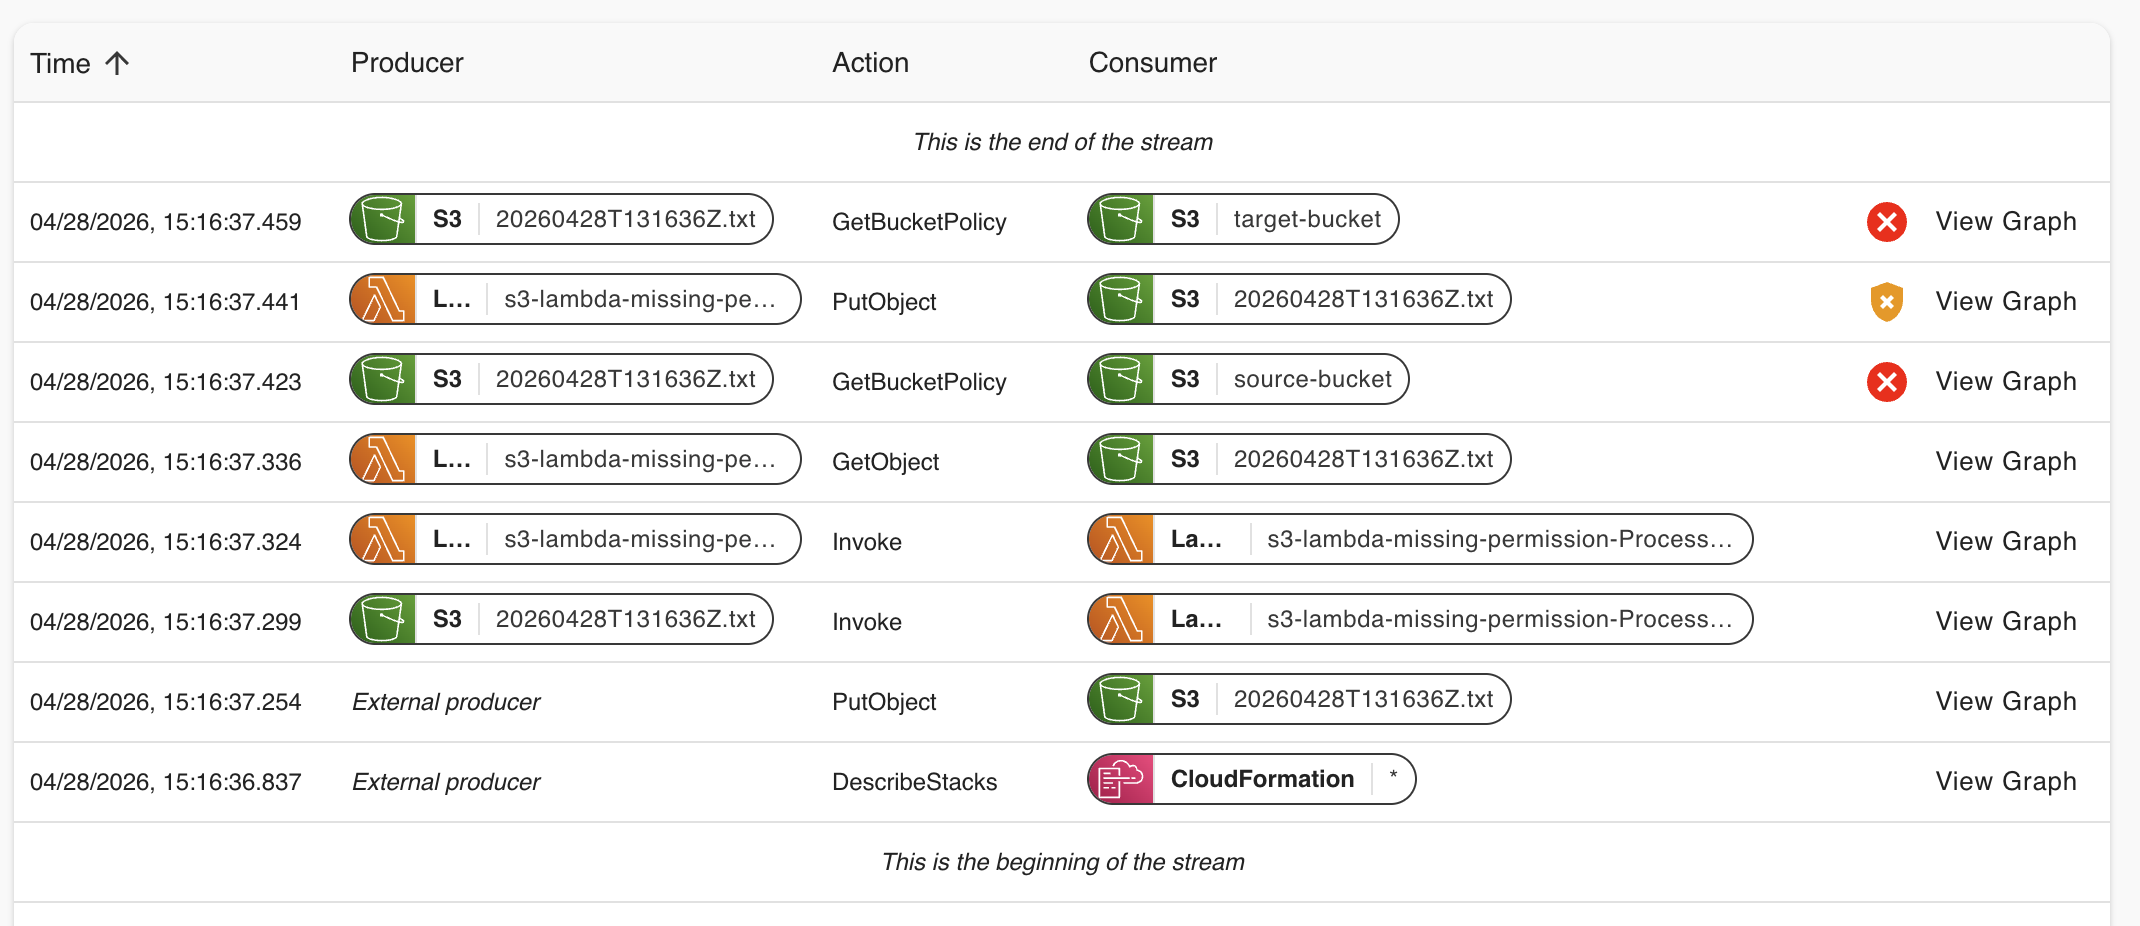
You should see the request flow through two rows: an Invoke on messages-api, followed by a PutItem on Messages. Click View Graph on either row to see them rendered as connected nodes, then click a node to open Operation Details — service, action, resource ARN, duration, status, and the exact request/response payload.
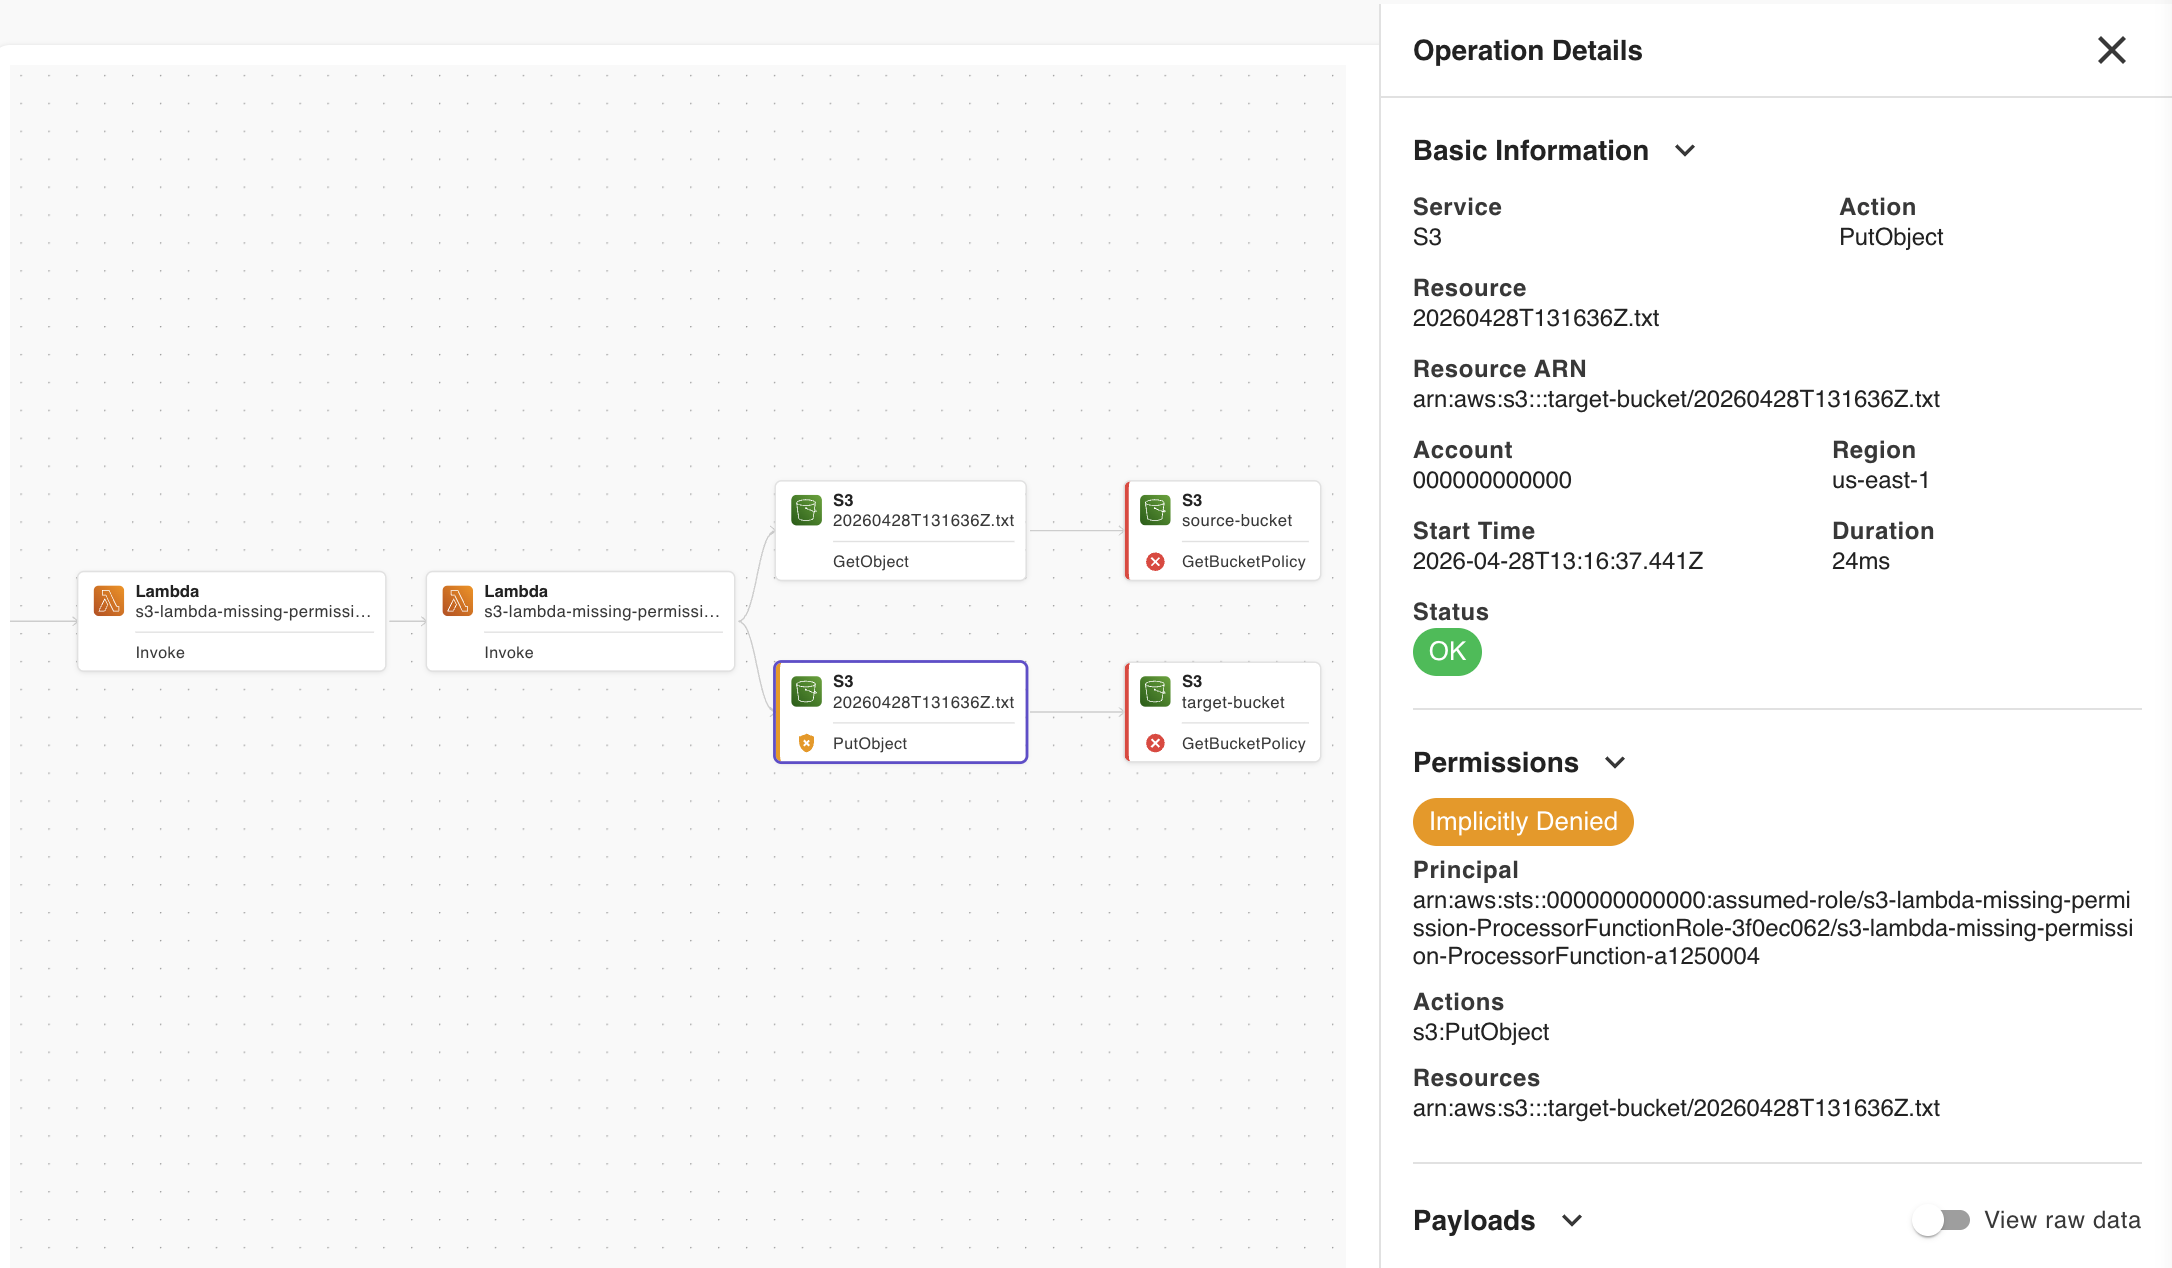
For this demo app, every operation should show a green OK status and an Allowed permissions badge — there’s nothing to fix. This is exactly where you would spot problems if there were any: a call that never reaches its target shows where the chain breaks, and a missing IAM permission shows up as an Implicitly Denied badge on the specific action, with the principal and required permission called out, well before you’d hit the same error against real AWS.
Testing and Validation
Section titled “Testing and Validation”Run through this end-to-end check to confirm everything from this guide is working together:
# 1. Confirm resources are deployedlstk status
# 2. Trigger the function and capture the responsecurl -X POST "$LAMBDA_URL" \  -H "Content-Type: application/json" \  -d '{"message": "Final validation check"}'
# 3. Retrieve the full message historycurl "$LAMBDA_URL"
Cross-check the output of the last command against what you see in the DynamoDB Items view in the Resource Browser — the counts and message content should match exactly. Then confirm the same request appears as a fresh row in App Inspector with an OK status.
Troubleshooting
Section titled “Troubleshooting”Instance shows as “not running” in Instance Management
Run lstk status from your terminal to confirm the container’s actual state, and check that Docker is running. Start it again with lstk start if needed — remember this gives you an empty instance unless you load a Cloud Pod afterwards.
Resource Browser shows a “Network Failure” error
The LocalStack container isn’t running, or isn’t reachable at the endpoint configured for the instance. Confirm the endpoint in Instance Management matches your running container (https://localhost.localstack.cloud:4566 by default).
Lambda function or DynamoDB table don’t appear anywhere in the web app
Check the region dropdown in the top-right of the Resource Browser. If it’s set to a region other than the one you deployed to (us-east-1 by default in the tutorial), switch it.
Resources are missing after a restart, even though you didn’t mean to wipe them
LocalStack does not persist state across restarts by default. Either avoid stopping the container, enable persistence, or restore your last Cloud Pod with lstk snapshot load pod:<name>.
lstk snapshot save fails with an authentication or license error
Cloud Pods require a valid LocalStack account. Run lstk login, or confirm LOCALSTACK_AUTH_TOKEN is set correctly, and try again.
lstk snapshot load warns about a version mismatch
This happens when the LocalStack version that saved the pod differs from the one running now. It’s safe to proceed for this demo; in real projects, pin your LocalStack version to avoid state incompatibilities.
App Inspector isn’t listed in the sidebar
It requires LocalStack 2026.04.0 or later. Check your running version with lstk status.
Next steps
Section titled “Next steps”You’ve now used all four core areas of the LocalStack Web Application to inspect, manage, snapshot, and debug a running application. To go deeper on any of them:
- Instance Management — bookmarking instances and connecting to a LocalStack instance running on another machine.
- Stack Overview — the full list of supported resource types.
- Resource Browser — the complete list of supported services beyond Lambda and DynamoDB.
- Cloud Pods — merge strategies, remotes, auto-loading pods on startup, and sharing state with your team.
- App Inspector — using it from the LocalStack Toolkit for VS Code without leaving your editor.
lstkCLI reference — the full set ofsnapshot,status, andresetcommands used in this guide.
Once you’re comfortable with the local workflow, continue to the CI/CD guide to bring LocalStack into your automated pipelines.